June 24, 2022 by Nihanth Cherukuru
Tactile representations of arctic sea ice data

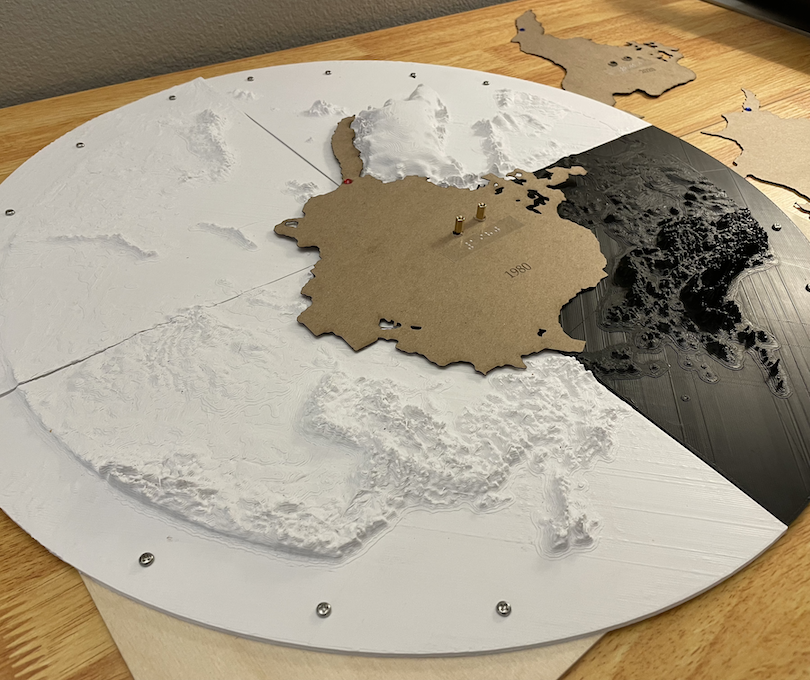
Data visualizations are not the only way to communicate scientific insights; 3D printing & laser cutting offer an inclusive, hands-on way to share data. As part of a larger data visualization accessibility project, VAST researchers & educators are developing tactile data representations of arctic sea ice extant. Here, the September mean sea ice extent data simulation was 3D printed with the assistance of Boulder Public Library’s BLDG61, including laser cutouts of changing sea ice at different time stamps. Visit the project page to learn more about this work.